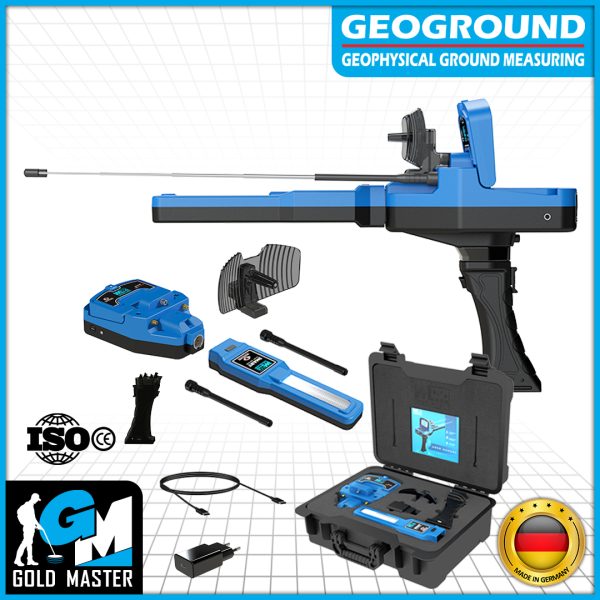
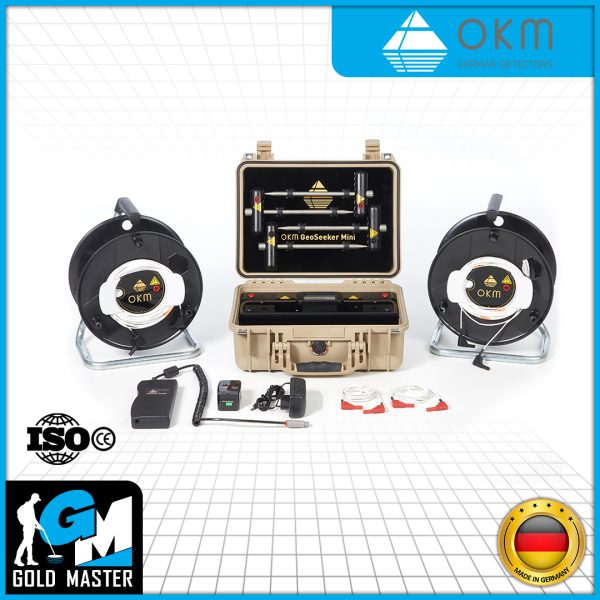
Geo seeker Mini Features
Geo electrical Measuring Technology
Geo Seeker Mini groundwater detector depends on geoelectrical measurement technology based on measuring of electrical resistivity characteristics of underground water resources or cavities. Groundwater has a very good conductivity thus the device measures the conductivity changes in the specific ground area to indicate the presence of water resources. However bad conductivity is a hint or indicator of cavities existence such as chambers, tunnels, graves, and so on. So, based on conductivity values users can use the device either as a water detector or cavity detector at a reasonable price.
Device Applications
Water Resources Detection
GeoSeeker Mini has many versatile applications in groundwater detection for water finders like good builders, and also drilling companies agriculture companies farmers, or even building contractors. The applications of the device can be summarized as:
Finding water deposits include fresh water, drinking water
Know the groundwater level also
Detect underground watercourse, water veins
Find underground water streams, headwaters
Cavity Detection
The capability of cavity detection is useful for archaeologists, historians treasure hunters, geotechnical engineers, military services, and building contractors. Some examples of types of cavities include:
caves, tunnels
galleries and manholes
chambers, sepulchers, tombs
bunkers, vaults, cellars, rooms
Easy Operation
Geo Seeker Mini includes an easy-to-use updated graphical user interface with a screen that supports touch for easy quick operation. After the selection of measurement depth and amount of scanning points, simple graphical instructions guide through the measuring procedure.
Placing The Electrodes
During the measurement, the electrodes have to be replaced several times to measure the ground resistance at certain places. Then all instructions can be read from the color display screen, where the results are presented after each single scan. Then At the very end of a measurement, the final result is shown as a graphical 2D scan image.
Graphical Data Visualization
The results of the measurement are visualized in a 2D diagram or more simple representations using unambiguous pictures. However, after finishing a geoelectrical measurement, the final result is calculated to generate a representative 2D scan image of the underground resistivity. So with the pictographs in the lower display area, users can read directly the diagram: The colors in the scheme indicate water deposits (such as blue with water drops) and/or detected cavities (red with tunnel symbol).


Reviews
There are no reviews yet.